
WHO WE SERVE — FIVE SECTORS
Five sectors, one delivery model.
Spatial Alphabet applies its engineering, AI-powered geospatial, application-development, and talent-acquisition capabilities across five core industry sectors — the same US + India team, applied locally in each market.
TRUSTED BY
INDUSTRY LEADERS






01 / 05 — INDUSTRY
Electrical Utilities
Pole loading, PLS-CADD/PLS-POLE T&D engineering, AutoCAD network design, and LiDAR vegetation monitoring for a grid in the middle of a global super-cycle.
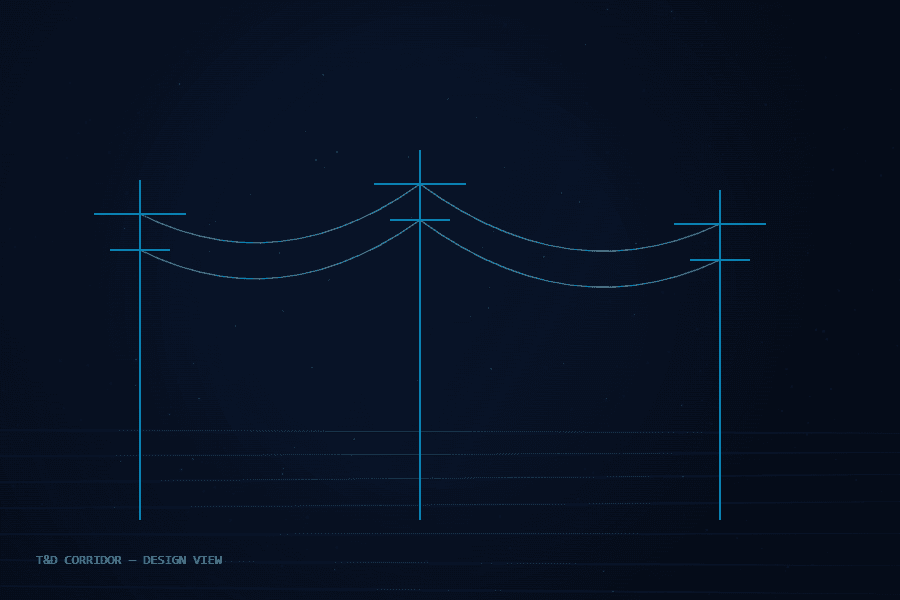
Grid infrastructure is in the middle of a global super-cycle: aging transmission and distribution networks are being rebuilt at the same time they must absorb record renewable capacity and surging demand from data centres and electrification. Spatial Alphabet supports utilities through exactly this build-out — with Pole Loading Analysis, PLS-CADD/PLS-POLE transmission and distribution engineering, AutoCAD network design, and LiDAR-based vegetation-clearance monitoring.
Because Spatial Alphabet already runs a Hyderabad Offshore Development Center alongside its Texas headquarters, it is structurally positioned to deliver in US hours, Middle East/UK overlap, and India-domestic — capturing a $1.5 trillion global cycle from a single team, without standing up separate regional operations.
HOW WE HELP
Pole Loading Analysis
NESC/GO95/ASCE pass-fail analysis at program scale, with make-ready identification and certified reports.
T&D engineering
PLS-CADD/PLS-POLE line design and AutoCAD network drawings your engineers approve first pass.
Vegetation monitoring
LiDAR-based encroachment analysis against NESC clearance thresholds along the corridor.
02 / 05 — INDUSTRY
Telecommunications
Pole Loading Analysis, HLD/LLD fiber network design, and permitting-through-make-ready for accelerating fiber and 5G build-out.
Fiber and 5G build-out is accelerating on every continent, driven by government subsidy programmes racing to close rural connectivity gaps and by AI/data-centre demand pulling fiber capacity toward hyperscale sites. Spatial Alphabet's Pole Loading Analysis, HLD/LLD fiber network design, and permitting-through-make-ready workflow map directly onto this wave of construction.
The same bottleneck shows up in every market — the US and UK closing last-mile gaps, India connecting its last unconnected villages, the Middle East building 5G corridors from scratch: subsidy dollars and licenses are released faster than networks can be structurally engineered, staked, and permitted. That is the layer Spatial Alphabet operates in, run locally in each market.
HOW WE HELP
Pole Loading Analysis
Structural analysis for telecom attaches, with make-ready identification and certified reports.
Fiber design (HLD/LLD)
Route, topology, and fiber-count sizing through pole-by-pole staking, splice diagrams, and BOM.
Permitting & make-ready
Attachment and ROW applications tracked through to Notice to Proceed.
03 / 05 — INDUSTRY
Oil & Gas
Corridor mapping, LiDAR-based encroachment monitoring, and legacy-drawing digitization for record-pace pipeline and midstream expansion.
Even as power grids electrify, pipeline and midstream infrastructure is being expanded at record pace to move gas to LNG export terminals and gas-fired power plants feeding data-centre demand. Spatial Alphabet's corridor mapping, LiDAR-based encroachment monitoring, and legacy-drawing digitization are directly transferable to this build-out.
US shale-linked pipeline expansion, Gulf state megaprojects, UK institutional asset transfers, and India's National Gas Grid all reduce to the same three services: corridor mapping, encroachment monitoring, and legacy-asset digitization. This is where our electrical-utility and telecom track record points next — the same Hyderabad-and-Texas delivery model, built to extend into pipeline corridors the moment a first reference project closes the gap.
HOW WE HELP
Corridor mapping
Centerline and corridor data captured, structured, and kept current with construction.
Encroachment monitoring
LiDAR-based analysis of vegetation and third-party encroachment along the route.
Legacy digitization
Paper and legacy records converted into structured, defensible as-built data.
04 / 05 — INDUSTRY
Transportation
Utility-conflict mapping and legacy-drawing digitization for road, rail, and freight corridors that constantly intersect utility and telecom networks.

Road, rail, and freight infrastructure is being rebuilt worldwide at a scale that constantly intersects utility and telecom corridors — meaning every highway widening, rail electrification, or freight-corridor project needs the same utility-conflict mapping and legacy-drawing digitization Spatial Alphabet already applies to electrical and telecom clients.
Almost none of it can be built without first knowing what utility and telecom infrastructure already occupies the corridor — routinely the reason projects stall. That is the exact problem Spatial Alphabet already solves, approached from the other direction: capability being extended into the sector as the reference project is won.
HOW WE HELP
Utility-conflict mapping
Existing utility and telecom infrastructure mapped along the corridor before design starts.
Corridor LiDAR
Classification and asset extraction along rail and roadway corridors.
Legacy digitization
Legacy drawings converted into structured, usable corridor records.
05 / 05 — INDUSTRY
Government & Public Sector
GIS asset mapping, GeoAI data conflation, and real-time monitoring dashboards — backed by a live flood-monitoring deployment.
Governments at every level are treating geospatial data as core public infrastructure — the platform underneath permitting, asset management, disaster response, and smart-city programmes. Spatial Alphabet's GIS asset mapping, GeoAI data conflation, and real-time monitoring dashboards sit squarely inside this shift.
Unlike Oil & Gas and Transportation, this is not capability being extended into a new market — Spatial Alphabet already has a live, working system: a real-time flood monitoring and field data collection platform for Hyderabad on QGIS, PostGIS, QField mobile capture, and Grafana dashboards, conflating rainfall, terrain, and flood-zone data into a single geodatabase that drives automated public alerts.
HOW WE HELP
GIS asset mapping
Parcel, utility, and public-asset data structured for permitting and asset management.
GeoAI data conflation
Heterogeneous sources reconciled into one authoritative, decision-ready geodatabase.
Monitoring dashboards
Real-time QField/Grafana dashboards and automated public alerting, proven in production.
C2 — PILOT PROGRAM
Not ready to commit? Start with a pilot.
Scope a Pilot →Paid or pro bono — your call. We take a real slice of your program, deliver it to production standard, and you evaluate the result before committing anything further.
01 — SCOPE
We define a bounded, representative work package with you — real data, real specs, one to three weeks.
02 — DELIVER
Our dual-shore team executes under the same QC protocol as a full engagement. No demo-grade shortcuts.
03 — EVALUATE
You audit the deliverables against your own acceptance criteria. Then decide — with evidence, not promises.